Predictive Modeling of Heating and Cooling Loads
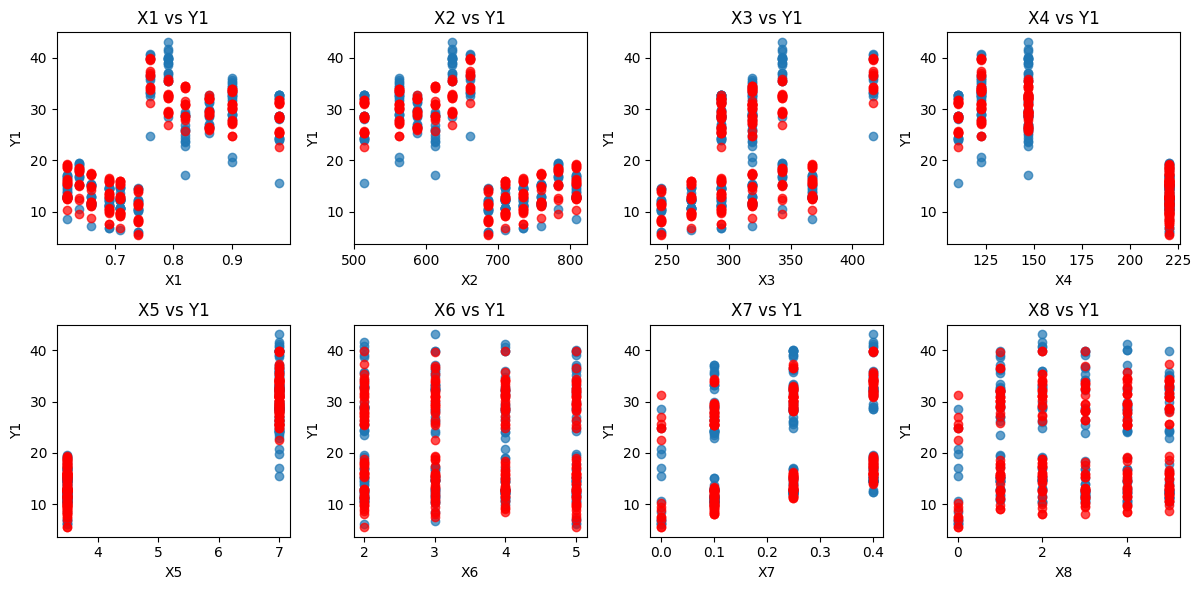
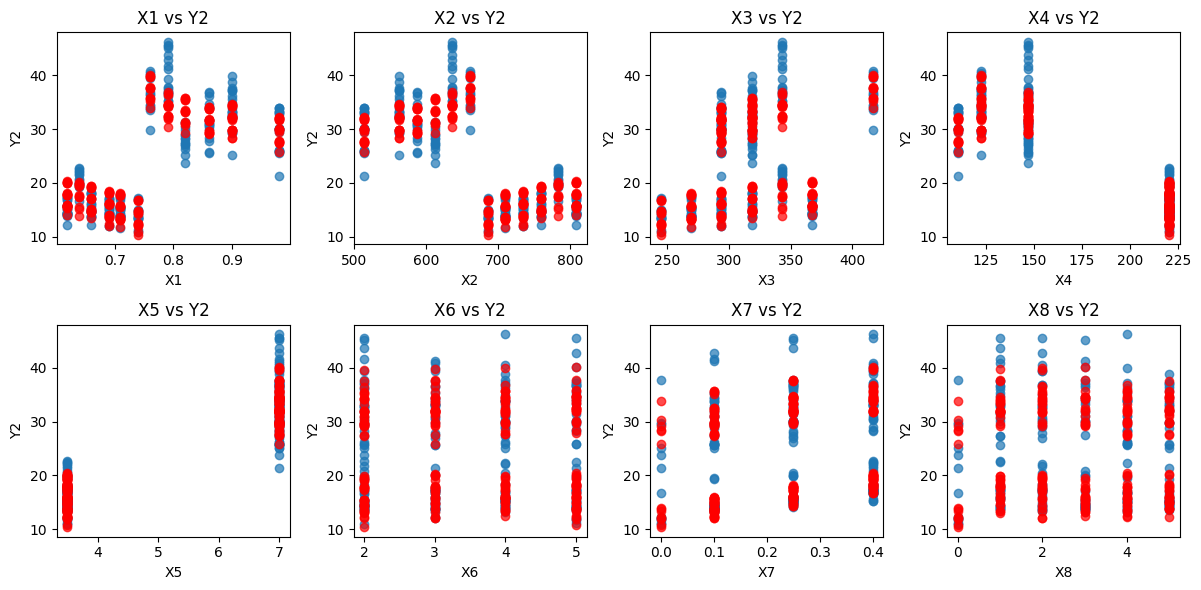
This project will denote parameters such as glazing area, orientation, etc., as (Xi), and targets such as heating load and cooling load as (Yi). Below shows the notation we will be using:
| Name | Role | Description |
|---|---|---|
| X1 | Feature | Relative Compactness |
| X2 | Feature | Surface Area |
| X3 | Feature | Wall Area |
| X4 | Feature | Roof Area |
| X5 | Feature | Overall Height |
| X6 | Feature | Orientation |
| X7 | Feature | Glazing Area |
| X8 | Feature | Glazing Area Distribution |
| Y1 | Target | Heating Load |
| Y2 | Target | Cooling Load |
Regression model
The equation for multi-dimensional (or multiple) linear regression can be written as:

After applying this model we get the below prediction plots:
looking over the residuals:

The residual plots for Y1 and Y2 suggest patterns rather than random scatter, indicating potential issues with model assumptions. The clustering of residuals hints at non-linearity or heteroscedasticity, where errors vary across different actual values. The red reference line at zero helps visualize systematic deviations, suggesting the model may not fully capture underlying trends. For now we have $R^2 = 0.9118$
More EDA

By analyzing the relationship between heating and cooling loads, I identified a strong linear correlation of 0.98, indicating a clear dependency between these two target variables. However, when applying K-Means clustering, I observed two distinct clusters: one where Y1 (scaled) is below 0.4 and another where it is above. This suggests that while the overall trend is linear, the variance in Y2 increases as Y1 increases, which introduces potential complexity in modeling.

To investigate this further, I examined the distribution of Y1 and Y2, visualized in the histogram plots. The global median Y1 (solid black line) and local median Y1 (dotted black line) provide additional insights:
- Y2 Distribution (Left Plot): The local median Y1 is lower than the global median Y1, indicating that certain subgroups within the data have a different central tendency, reinforcing the observed variance in Y2 at different Y1 levels.
- Y1 Distribution (Right Plot): The deviation between local and global medians suggests that Y1 itself is not evenly distributed across all observations, which could influence model performance if treated uniformly.
These findings support the idea that a single predictive model may not be optimal. Instead, a segmented approach, where we develop separate models for light loads and heavy loads, could provide better accuracy by addressing the differences in variance and distribution within each cluster.
This analysis highlights that while correlation is high, variability within the data demands a more tailored approach for predictive modeling. Moving forward, I would explore modeling techniques that account for these clusters separately, ensuring a more precise representation of heating and cooling loads.
References and Data Sources 📖
Below are links to all the resources I used in developing this project.
- The data for this project is sourced from UCI Machine Learning Repository, a platform offering publicly accessible datasets, including those related to building energy efficiency. The dataset includes details on heating and cooling loads, glazing area, and orientation, among other parameters.
Dataset URL: UCI Building Energy Dataset